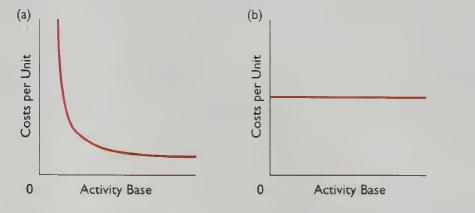
Which of the following graphs best illustrates fixed costs per unit as the activity base changes? LO2
Question:
Which of the following graphs best illustrates fixed costs per unit as the activity base changes? LO2

Fantastic news! We've Found the answer you've been seeking!
Step by Step Answer:
Related Book For 

Question Posted:


