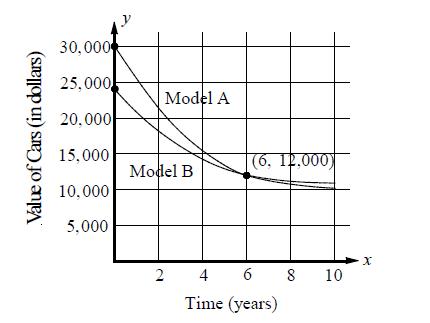
In the graph, each exponential curve represents the values, in dollars, of two different cars as a
Question:
In the graph, each exponential curve represents the values, in dollars, of two different cars as a function of time in years. At time t = 0, the price of model A was $30,000 and the price of model B was $24,000. At time t = 6, the price of both models were $12,000. Based on the graphs above, which of the following must be true?
I. At time t = 0, the price of model A was 25% more than the price of model B.
II. At time t = 0, the price of model B was 20% less than the price of model A.
III. From time t = 0 to t = 6, the average rate of decrease in the value of model A was 1.5 times the average rate of decrease in the value of model B.
A) I and II only
B) I and III only
C) II and III only
D) I, II, and III
Fantastic news! We've Found the answer you've been seeking!
Step by Step Answer:
Related Book For 

Question Posted:


