=A f. Use SensIt to generate a spider chart and tornado chart with respect to the profit,
Question:
=A
f. Use SensIt to generate a spider chart and tornado chart with respect to the profit, loss, and cost data when each can vary as much as 25 percent in either direction from its base value.
Fantastic news! We've Found the answer you've been seeking!
Step by Step Answer:
Related Book For 

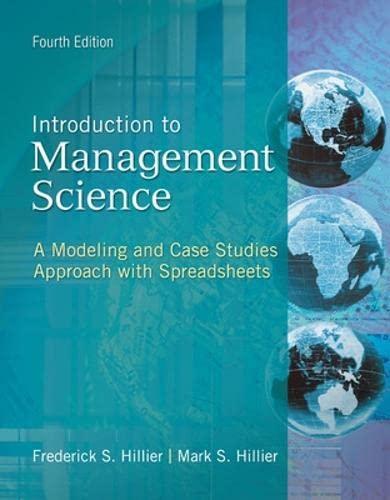
Introduction To Management Science A Modeling And Case Studies Approach With Spreadsheets
ISBN: 9780078096600
4th Edition
Authors: Frederick S. Hillier And Mark S. Hillier
Question Posted:


