

Question: The monthly aircraft sales data throughout last year can be seen in the table below. Check and see if there is normality in the data.
The monthly aircraft sales data throughout last year can be seen in the table below. Check and see if there is normality in the data. Consider a ¼5%.
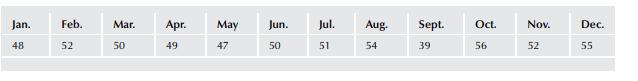
Jan. Feb. Mar. Apr. May Jun. Jul. Aug. Sept. Oct. Nov. Dec. 48 52 50 49 47 50 51 54 39 56 52 55
Step by Step Solution
There are 3 Steps involved in it
1 Expert Approved Answer
Step: 1 Unlock

Question Has Been Solved by an Expert!
Get step-by-step solutions from verified subject matter experts
Step: 2 Unlock
Step: 3 Unlock