

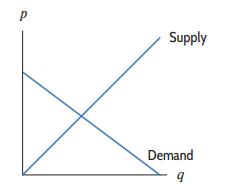
Question: Linear supply and demand curves are shown in Figure 1.66, with price on the vertical axis. (a) Label the equilibrium price p 0 and the
Linear supply and demand curves are shown in Figure 1.66, with price on the vertical axis.
(a) Label the equilibrium price p0 and the equilibrium quantity q0 on the axes.
(b) Explain the effect on equilibrium price and quantity if the slope, Δp∕Δq, of the supply curve increases. Illustrate your answer graphically.
(c) Explain the effect on equilibrium price and quantity if the slope, Δp∕Δq, of the demand curve becomes more negative. Illustrate your answer graphically.
Figure 1.66
P Supply Demand 9
Step by Step Solution
3.55 Rating (162 Votes )
There are 3 Steps involved in it
a See Figure 137 b If the slope of the supply curve increases then the supply curve wi... View full answer

Get step-by-step solutions from verified subject matter experts