

Question: The following table shows the total sales, in thousands, since a new game was brought to market.(a) Plot this data and mark on your plot
The following table shows the total sales, in thousands, since a new game was brought to market.(a) Plot this data and mark on your plot the point of diminishing returns.(b) Predict total possible sales of this game, using the point of diminishing returns.
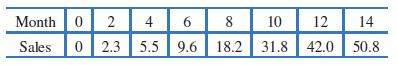
Month 0 2 4 Sales 0 2.3 5.5 6 8 10 12 14 9.6 18.2 31.8 42.0 50.8
Step by Step Solution
★★★★★
3.30 Rating (165 Votes )
There are 3 Steps involved in it
1 Expert Approved Answer
Step: 1 Unlock

a The data is plotted in Figure 4127 On the intervals less than 10 the average rate o... View full answer
Question Has Been Solved by an Expert!
Get step-by-step solutions from verified subject matter experts
Step: 2 Unlock
Step: 3 Unlock