

Question: A article in the Journal of Quality in Clinical Practice [The Application of Statistical Process Control Charts to the Detection and Monitoring of Hospital-Acquired Infections,
(a) What distribution might be expected for these data? What type of control chart might be appropriate?
(b) Construct the chart you selected in part (a).
(c) Construct a CUSUM chart for these data with k = 0.5 and h = 4. The article included a similarly construced CUSUM chart. What is assumed for the distribution of the data in this chart? Can your CUSUM chart perform adequately?
(d) Repeat part (c) for an EWMA chart with λ = 0.2.
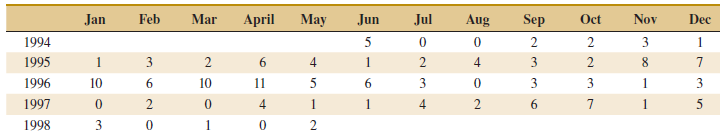
Feb Mar Sep 2 3 3 April Aug Nov Oct Dec Jan May 5 1 Jun Jul 1994 1995 1996 1997 2 2 3 3 1 1 3 2 4 2 3 4 8. 11 10 6. 10 6. 5 1 2 4 6. 3 1998
Step by Step Solution
3.32 Rating (170 Votes )
There are 3 Steps involved in it
a A Poisson distribution is expected and a C chart might ... View full answer

Get step-by-step solutions from verified subject matter experts