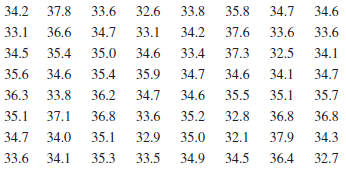
Construct histograms with 8 and 16 bins for the data in Exercise 6-32. Compare the histograms. Do
Question:
Data from 6-32
Transcribed Image Text:
37.8 33.6 34.2 32.6 33.8 35.8 34.7 34.6 33.1 33.1 36.6 34.7 34.2 37.6 33.6 33.6 34.5 35.4 35.0 34.6 33.4 37.3 32.5 34.1 35.6 34.6 35.4 35.9 34.7 34.6 34.1 34.7 36.3 33.8 36.2 34.7 34.6 35.5 35.1 35.7 35.1 37.1 36.8 33.6 35.2 32.8 36.8 36.8 35.1 34.7 34.0 32.9 35.0 32.1 37.9 34.3 33.6 34.1 35.3 33.5 34.9 34.5 36.4 32.7
Fantastic news! We've Found the answer you've been seeking!
Step by Step Answer:
Answer rating: 53% (13 reviews)
Histogram 8 bins Histogram 16 Bins Yes both ...View the full answer
Answered By
Ashington Waweru
I am a lecturer, research writer and also a qualified financial analyst and accountant. I am qualified and articulate in many disciplines including English, Accounting, Finance, Quantitative spreadsheet analysis, Economics, and Statistics. I am an expert with sixteen years of experience in online industry-related work. I have a master's in business administration and a bachelor’s degree in education, accounting, and economics options.
I am a writer and proofreading expert with sixteen years of experience in online writing, proofreading, and text editing. I have vast knowledge and experience in writing techniques and styles such as APA, ASA, MLA, Chicago, Turabian, IEEE, and many others.
I am also an online blogger and research writer with sixteen years of writing and proofreading articles and reports. I have written many scripts and articles for blogs, and I also specialize in search engine
I have sixteen years of experience in Excel data entry, Excel data analysis, R-studio quantitative analysis, SPSS quantitative analysis, research writing, and proofreading articles and reports. I will deliver the highest quality online and offline Excel, R, SPSS, and other spreadsheet solutions within your operational deadlines. I have also compiled many original Excel quantitative and text spreadsheets which solve client’s problems in my research writing career.
I have extensive enterprise resource planning accounting, financial modeling, financial reporting, and company analysis: customer relationship management, enterprise resource planning, financial accounting projects, and corporate finance.
I am articulate in psychology, engineering, nursing, counseling, project management, accounting, finance, quantitative spreadsheet analysis, statistical and economic analysis, among many other industry fields and academic disciplines. I work to solve problems and provide accurate and credible solutions and research reports in all industries in the global economy.
I have taught and conducted masters and Ph.D. thesis research for specialists in Quantitative finance, Financial Accounting, Actuarial science, Macroeconomics, Microeconomics, Risk Management, Managerial Economics, Engineering Economics, Financial economics, Taxation and many other disciplines including water engineering, psychology, e-commerce, mechanical engineering, leadership and many others.
I have developed many courses on online websites like Teachable and Thinkific. I also developed an accounting reporting automation software project for Utafiti sacco located at ILRI Uthiru Kenya when I was working there in year 2001.
I am a mature, self-motivated worker who delivers high-quality, on-time reports which solve client’s problems accurately.
I have written many academic and professional industry research papers and tutored many clients from college to university undergraduate, master's and Ph.D. students, and corporate professionals. I anticipate your hiring me.
I know I will deliver the highest quality work you will find anywhere to award me your project work. Please note that I am looking for a long-term work relationship with you. I look forward to you delivering the best service to you.
3.00+
2+ Reviews
10+ Question Solved
Related Book For
Applied Statistics And Probability For Engineers
ISBN: 9781118539712
6th Edition
Authors: Douglas C. Montgomery, George C. Runger
Question Posted:
Students also viewed these Mathematics questions
-
Construct a standardized control chart for the data in Exercise 7.29. In Exercise 7.29 - TABLE 7E.10 Data for Exercise 7.29 Total Visit Visit Week Requests Required Week Requests Required 10o 100 100...
-
Construct a standardized control chart for the data in Exercise 7.11. In Exercise 7.11 a TABLE 7E.5 Personal Computer Inspecting Results for Exercise 7.11 Units Nonconformin Units g Fraction Day...
-
Construct a pie graph for the data in Exercise 1, and analyze the results. (23)
-
In Exercises 8594, find all values of x satisfying the given conditions. y = 2x + x 8x + 2 and y = 6.
-
The following data represent the age of the mother at childbirth for 1980 and 2013. (a) Approximate the population mean and standard deviation of age for mothers in 1980. (b) Approximate the...
-
Why has Congress criticized nonattest services?
-
Using the Loans_training data set, construct a CART model and a C5.0 model for predicting loan approval.
-
Rockport Municipal Marina is considering adding a new dock to accommodate large yachts. The dock would cost $700,000 and would generate $144,000 annually in new cash inflows. Its expected life would...
-
Problem 18-17 The Duo Growth Company just paid a dividend of $3.00 per share. The dividend is expected to grow at a rate of 15% per year for the next three years and then to level off to 9% per year...
-
A laser pointer is kept at a constant and fixed height above the floor, but it can move horizontally back and forth in a straight line. A mirror is placed on a platform at a fixed distance from a...
-
Construct histograms with 8 and 16 bins for the data in Exercise 6-31. Compare the histograms. Do both histograms display similar information? Data from 6-31 1115 865 1015 885 1594 1000 1416 1501...
-
Construct a histogram for the energy consumption data in Exercise 6-37. Data from 6-37 Billions of Kilowatt-Hours Afghanistan 1.04 Australia 200.66 Bangladesh 16.20 6.88 Burma 1671.23 China 38.43...
-
Given that Y ~B(7, 0.6), find: a. P(Y = 7) b. P(Y = 5) c. P(Y 4) d. P(3
-
Shamika conducts a study comparing the performance of individuals on the first quiz in each of two classes taken in the first term of their freshman year. The scores, out of 100, are provided for...
-
Adult Sleep Times (hours) of sleep for randomly selected adult subjects included in the National Health and Nutrition Examination Study are listed below. Here are the statistics for this sample: n =...
-
Topic: I made a couple changes X Zag HCHW Ch 2 (31) (1).pdf X W2ag HW Ch 1 (20) - Physics 2ag X /Desktop%20user/Downloads/2ag%20HCHW%20Ch%202%20(31) %20(1).pdf f o search Hi 2/14 - I + 90% + 1.1 a....
-
Cashless Society. 40% of consumers believe that cash will be obsolete in the next 20 years (based on a survey by J.P. Morgan Chase). In each of Exercises 15-20, assume that 8 consumers are randomly...
-
Pacifico Company, a U . S . - based importer of beer and wine, purchased 1 , 3 0 0 cases of Oktoberfest - style beer from a German supplier for 3 1 2 , 0 0 0 euros. Relevant U . S . dollar exchange...
-
Give the eccentricities and the vertices or foci of hyperbolas centered at the origin of the xy-plane. In each case, find the hyperbolas standard-form equation in Cartesian coordinates. Eccentricity:...
-
Distinguish between the work performed by public accountants and the work performed by accountants in commerce and industry and in not-for-profit organisations.
-
How much television were American adults watching in 2014 (TVHOURS)? Produce a histogram to help answer the question.
-
How well were Americans doing financially in 2014. Draw a histogram of respondents incomes (RINCOME). Describe the shape.
-
How educated were American adults in 2014? Draw a histogram to help provide a graphical answer (EDUC).
-
Sociology
-
I am unsure how to answer question e as there are two variable changes. In each of the following, you are given two options with selected parameters. In each case, assume the risk-free rate is 6% and...
-
On January 1, Interworks paid a contractor to construct a new cell tower at a cost of $850,000. The tower had an estimated useful life of ten years and a salvage value of $100,000. Interworks...
Study smarter with the SolutionInn App