

Question: Determine the covariance and correlation for the CD4 counts in a month and the following month in Exercise 5-30. Exercise 5-30 An article in Health
Determine the covariance and correlation for the CD4 counts in a month and the following month in Exercise 5-30.
Exercise 5-30
An article in Health Economics [€œEstimation of the Transition Matrix of a Discrete-Time Markov Chain€ (2002, Vol.11, pp. 33€“42)] considered the changes in CD4 white blood cell counts from one month to the next. The CD4 count is an important clinical measure to determine the severity of
HIV infections. The CD4 count was grouped into three distinct categories: 0€“49, 50€“74, and ‰¥ 75. Let X and Y denote the (category minimum) CD4 count at a month and the following month, respectively. The conditional probabilities for Y given values for X were provided by a transition probability matrix shown in the following table.
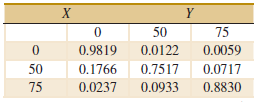
This table is interpreted as follows. For example, P(Y = 50 | X = 75) = 0.0717. Suppose also that the probability distribution for X is P(X = 75) = 0.9,P(X = 50) = 0.08,P(X = 0) = 0.02. Determine the following:
(a) P(Y ‰¤ 50 | X = 50)
(b) P(X = 0,Y = 75)
(c) E(Y | X = 50)
(d) fY (y)
(e) fXY (x, y)
(f) Are X and Y independent?
50 75 0.0059 0.9819 0.0122 50 75 0.7517 0.0933 0.1766 0.0237 0.0717 0.8830
Step by Step Solution
3.33 Rating (165 Votes )
There are 3 Steps involved in it
From the solution for the referenced exercis... View full answer

Get step-by-step solutions from verified subject matter experts