

Question: The pull strength of a wire-bonded lead for an integrated circuit is monitored. The following table provides data for 20 samples each of size 3.
The pull strength of a wire-bonded lead for an integrated circuit is monitored. The following table provides data for 20 samples each of size 3.
(a) Use all the data to determine trial control limits for X and R charts, construct the control limits, and plot the data.
(b) Use the control limits from part (a) to identify out-of-control points. If necessary, revise your control limits assuming that any samples that plot outside of the control limits can be eliminated.
(c) Repeat parts (a) and (b) for X and S charts.
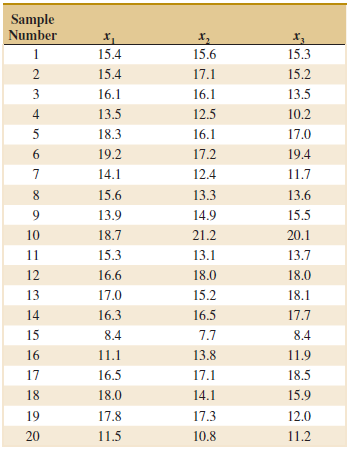
Sample Number 15,3 15.4 15.6 15.4 17.1 15.2 3 16.1 16.1 13.5 4. 13.5 12.5 10.2 17.0 5 18.3 16.1 17.2 19.2 19.4 14.1 12.4 11.7 15.6 13.3 13.6 15.5 13.9 14.9 18.7 21.2 10 20.1 11 15.3 13.1 13.7 18.0 12 16.6 18.0 13 17.0 15.2 18.1 14 16.3 16.5 17.7 7.7 15 8.4 8.4 16 11.1 13.8 11.9 17 16.5 17.1 18.5 18 18.0 14.1 15.9 17.8 19 17.3 12.0 20 11.5 10.8 11.2
Step by Step Solution
3.44 Rating (167 Votes )
There are 3 Steps involved in it
a b Removed points 4 6 7 10 12 15 16 19 and 20 and revised the control limit... View full answer

Get step-by-step solutions from verified subject matter experts