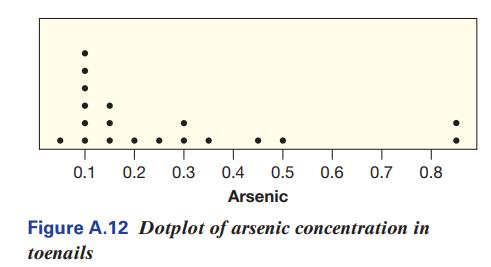
Figure A.12 shows a dotplot of the arsenic concentrations in Table A.11. (a) Which measures of center
Question:
Figure A.12 shows a dotplot of the arsenic concentrations in Table A.11.


(a) Which measures of center and spread are most appropriate for this distribution: the mean and standard deviation or the five number summary? Explain.
(b) Is it appropriate to use the 95% rule about having 95% of the data within two standard deviations for this distribution? Why or why not?
Transcribed Image Text:
Table A.11 Arsenic concentration in toenail clippings 0.119 0.118 0.099 0.118 0.275 0.358 0.080 0.158 0.310 0.105 0.073 0.832 0.517 0.851 0.269 0.433 0.141 0.135 0.175
Fantastic news! We've Found the answer you've been seeking!
Step by Step Answer:
Answer rating: 72% (11 reviews)
Clearly the dotplot shows that the data is not sym...View the full answer

Answered By

Bhartendu Goyal
Professional, Experienced, and Expert tutor who will provide speedy and to-the-point solutions. I have been teaching students for 5 years now in different subjects and it's truly been one of the most rewarding experiences of my life. I have also done one-to-one tutoring with 100+ students and help them achieve great subject knowledge. I have expertise in computer subjects like C++, C, Java, and Python programming and other computer Science related fields. Many of my student's parents message me that your lessons improved their children's grades and this is the best only thing you want as a tea...
3.00+
2+ Reviews
10+ Question Solved
Related Book For 

Statistics Unlocking The Power Of Data
ISBN: 9781119682219
3rd Edition
Authors: Robin H Lock, Patti Frazer Lock, Kari Lock Morgan, Eric F Lock, Dennis F Lock
Question Posted:
Students also viewed these Statistics questions
-
Figure 2.29 shows a dotplot of the arsenic concentrations in Table 2.23. Figure 2.29 Table 2.23 (a) Which measures of center and spread are most appropriate for this distribution: the mean and...
-
Planning is one of the most important management functions in any business. A front office managers first step in planning should involve determine the departments goals. Planning also includes...
-
The stem-and-leaf display shows populations of the 50 states, in millions of people, according to the 2010 census. a) What measures of center and spread are most appropriate? b) Without doing any...
-
Refer to the facts presented in problem P7-13. In problem On January 25, 2011, Douglas Ltd. purchased 1,000 common shares of BMO (Bank of Montreal) for $65 each. During the remainder of 2011, Douglas...
-
Cline has just won a lottery. She will receive a payment of $6,000 at the end of each year for nine years. As an alternative, she can choose an immediate payment of $50,000. a. Which alternative...
-
Preparing the sales budget includes calculating the revenues to be earned from units sold in addition to the number of units to be sold. True False
-
Analyze the challenges in communicating in a socially diverse society.(pp. 132134)
-
J&J Snack Foods Corp. is a national manufacturer and distributor of snack foods and frozen beverages. Among its brands are ICEE, SuperPretzel, and Cinnabon CinnaPretzel. Adapted versions of the...
-
A stock has an expected rate of return of 18.5% and a variance of 0.00264. What is the standard deviation for this stock? round to 2 decimals
-
Taggart Corp. records adjustments each month before preparing monthly financial statements. The following selected account balances on May 31, 2012 and June 30, 2012, reflect month-end adjustments:...
-
A Canadian longitudinal study examines whether giving antibiotics in infancy increases the likelihood that the child will be overweight later in life. The children were classified as having received...
-
To predict the outcome of an election, 2500 likely voters are randomly selected to take a survey. (a) Does the study appear to use random sampling? (Yes or No) (b) Does the study appear to use random...
-
Fill in the blanks with an appropriate word, phrase, or symbol(s). Problems that generally involve seeking the least expensive or shortest way to travel among several locations are called traveling...
-
As of June 30, 2012, the bank statement showed an ending balance of \(\$ 13,879.85\). The unadjusted Cash account balance was \(\$ 13,483.75\). The following information is available: 1. Deposit in...
-
An engineering study has developed the following cost data for the production of product A: (1) If the current production level is 1,500 units, what is the incremental cost of producing an additional...
-
On December 1, a group of individuals formed a corporation to establish the Local, a neighborhood weekly newspaper featuring want ads of individuals and advertising of local firms. The free paper...
-
Design an arithmetic circuit with one selection variable S and two n-bit data inputs A and B. The circuit generates the following four arithmetic operations in conjunction with the input carry C in ....
-
For the system you chose for Problems and Exercises 3, complete section 4.0, A-C, Management Issues, of the BPP Report. Why might people sometimes feel that these additional steps in the project plan...
-
In practice, the chlorination of methane often produces many by-products. For example, ethyl chloride is obtained in small quantities. Can you suggest a mechanism for the formation of ethyl chloride?
-
A woman at a point A on the shore of a circular lake with radius 2 mi wants to arrive at the point C diametrically opposite on the other side of the lake in the shortest possible A time. She can walk...
-
Twenty cases: Cases are classified according to one variable, with categories A and B, and also classified according to a second variable with categories 1, 2, and 3. The cases are shown, with the...
-
Of the 361 students who answered the question about the number of piercings they had in their body, 188 had no piercings, 82 had one or two piercings, and the rest had more than two. Construct a...
-
Of the 362 students who answered the question about what award they would prefer, 31 preferred an Academy Award, 149 preferred a Nobel Prize, and 182 preferred an Olympic gold medal. Construct a...
-
You plan to buy a house for $325,000 today. If the house is expected to appreciate in value 8% each year, what will its value be seven years from now?
-
A designated beneficiary of an ABLE account must be ___________ in order to meet the special rules that apply to the increased contribution limit authorized under the Tax Cuts and Jobs Act? a. an...
-
Stans wholesale buys canned tomatoes from canneries and sells them to retail markets Stan uses the perpetual inventory

Study smarter with the SolutionInn App


