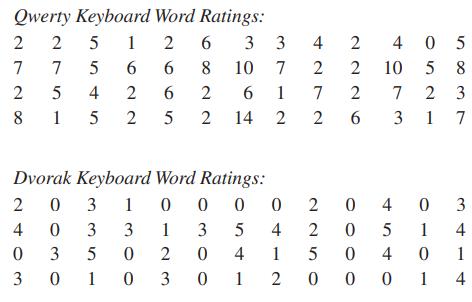
Refer to the Dvorak data in Exercise 19 in Section 1 and construct a dotplot. Compare the
Question:
Refer to the Dvorak data in Exercise 19 in Section 1 and construct a dotplot. Compare the result to the dotplot in Exercise 23. Based on the results, does either keyboard configuration appear to be better? Explain.
Data From Exercise 23:-
Refer to the QWERTY data in Exercise 19 in Section 1 and construct a dotplot.
Data From Exercise 19 in Section 1:-
The traditional keyboard configuration is called a Qwerty keyboard because of the positioning of the letters QWERTY on the top row of letters. Developed in 1872, the Qwerty configuration supposedly forced people to type slower so that the early typewriters would not jam. Developed in 1936, the Dvorak keyboard supposedly provides a more efficient arrangement by positioning the most used keys on the middle row (or “home” row), where they are more accessible. A Discover magazine article suggested that you can measure the ease of typing by using this point rating system: Count each letter on the home row as 0, count each letter on the top row as 1, and count each letter on the bottom row as 2. For example, the word statistics would result in a rating of 7 on the Qwerty keyboard and 1 on the Dvorak keyboard, as shown below.

Using this rating system with each of the 52 words in the Preamble to the Constitution, we get the rating values below.

a. Create a frequency table for the Qwerty word ratings data. Use bins of 0–2, 3–5, 6–8, 9–11, and 12–14 Include a column for relative frequency.
b. Create a frequency table for the Dvorak word ratings data, using the same bins as in part
a. Include a column for relative frequency.
c. Based on your results from parts a and b, which keyboard arrangement is easier for typing? Explain.
Step by Step Answer:

Statistical Reasoning For Everyday Life
ISBN: 9780321904645
4th International Edition
Authors: Jeffrey Bennett, William L. Briggs, Mario F. Triola


