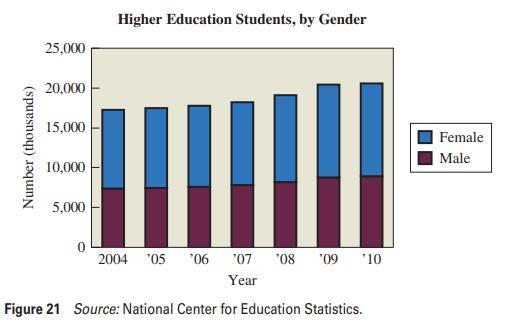
The stack plot in Figure 21 shows the numbers of male and female higher education students for
Question:
The stack plot in Figure 21 shows the numbers of male and female higher education students for different years. Projections are from the U.S. National Center for Education Statistics.
a. In words, discuss the trends revealed on this graphic.
b. Redraw the graph as a multiple line chart. Briefly discuss the advantages and disadvantages of the two different representations of this particular data set.

Fantastic news! We've Found the answer you've been seeking!
Step by Step Answer:
Related Book For 

Statistical Reasoning For Everyday Life
ISBN: 9780321904645
4th International Edition
Authors: Jeffrey Bennett, William L. Briggs, Mario F. Triola
Question Posted:


