

Question: Use the scatterplot for life expectancy and infant mortality in Figure 4. Data From Figure 4:- Frequency 20 15 10 10 5 2 3 4
Use the scatterplot for life expectancy and infant mortality in Figure 4.
Data From Figure 4:-
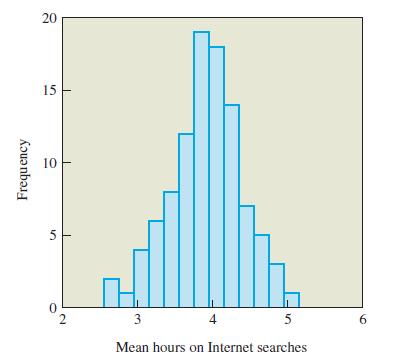
Frequency 20 15 10 10 5 2 3 4 5 6 Mean hours on Internet searches
Step by Step Solution
★★★★★
3.42 Rating (161 Votes )
There are 3 Steps involved in it
1 Expert Approved Answer
Step: 1 Unlock

Step 1 Define Variables Life expectancy is the average number of years a person is expected to live whereas infant mortality rate refers to the number ... View full answer
Question Has Been Solved by an Expert!
Get step-by-step solutions from verified subject matter experts
Step: 2 Unlock
Step: 3 Unlock