Perform the indicated operations if the given changes are made in the indicated examples of this section.
Question:
Perform the indicated operations if the given changes are made in the indicated examples of this section.
In Example 3, change the sign of the exponent and then plot the graph.
Data from Example 3
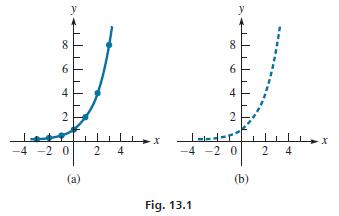
Plot the graph of y = 2x. For this function, we have the values in the following table:

The curve is shown in Fig. 13.1(a). In Chapter 1, we used only integer exponents, and the enlarged points are for these values. In Chapter 11, we introduced rational exponents, and using them would fill in many points between those for integers, but all the points for irrational numbers would be missing and the curve would be dotted [see Fig. 13.1(b)]. Using all real numbers for exponents, including the irrational numbers, we have all points on the curve shown in Fig. 13.1(a).
We see that the x-axis is an asymptote of the curve. The points on the left side of the graph get closer and closer to the x-axis, but they never touch it.

Step by Step Answer:

Basic Technical Mathematics
ISBN: 9780137529896
12th Edition
Authors: Allyn J. Washington, Richard Evans


