Question:
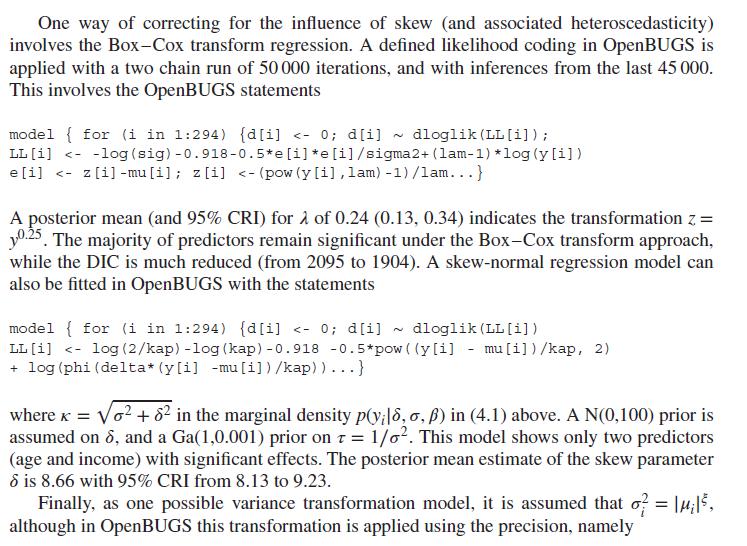
In Example 4.1, estimate a variance transformation model with \(\log \left(\sigma_{i}^{2}\right)=\xi_{0}+\xi_{1} \mu_{i}\), and compare its fit with a constant variance normal linear regression using the log pseudo marginal likelihood (LPML). It may facilitate estimation (if using OpenBUGS or WinBUGS) to use a transformation applied to the precision rather than variance. Identify the five cases with the highest influence statistics \(K\left(y, y_{[i]}\right)\), as described in Chapter 2, and assess the impact on the regression coefficients on excluding these subjects from the analysis.
Data from Example 4.1
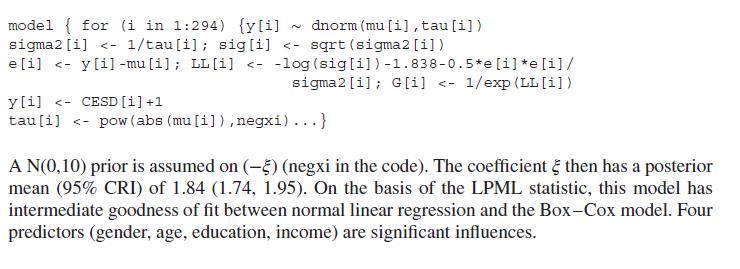
Transcribed Image Text:
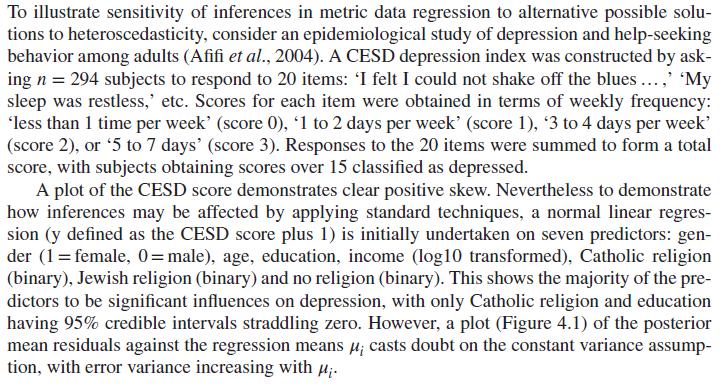
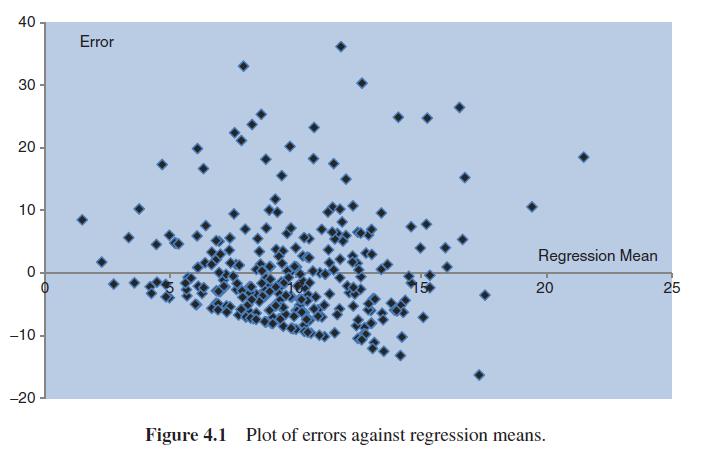
To illustrate sensitivity of inferences in metric data regression to alternative possible solu- tions to heteroscedasticity, consider an epidemiological study of depression and help-seeking behavior among adults (Afifi et al., 2004). A CESD depression index was constructed by ask- ing n = 294 subjects to respond to 20 items: 'I felt I could not shake off the blues ...,' 'My sleep was restless,' etc. Scores for each item were obtained in terms of weekly frequency: 'less than 1 time per week' (score 0), '1 to 2 days per week' (score 1), '3 to 4 days per week' (score 2), or '5 to 7 days' (score 3). Responses to the 20 items were summed to form a total score, with subjects obtaining scores over 15 classified as depressed. A plot of the CESD score demonstrates clear positive skew. Nevertheless to demonstrate how inferences may be affected by applying standard techniques, a normal linear regres- sion (y defined as the CESD score plus 1) is initially undertaken on seven predictors: gen- der (1 = female, 0=male), age, education, income (log10 transformed), Catholic religion (binary), Jewish religion (binary) and no religion (binary). This shows the majority of the pre- dictors to be significant influences on depression, with only Catholic religion and education having 95% credible intervals straddling zero. However, a plot (Figure 4.1) of the posterior mean residuals against the regression means ; casts doubt on the constant variance assump- tion, with error variance increasing with .


