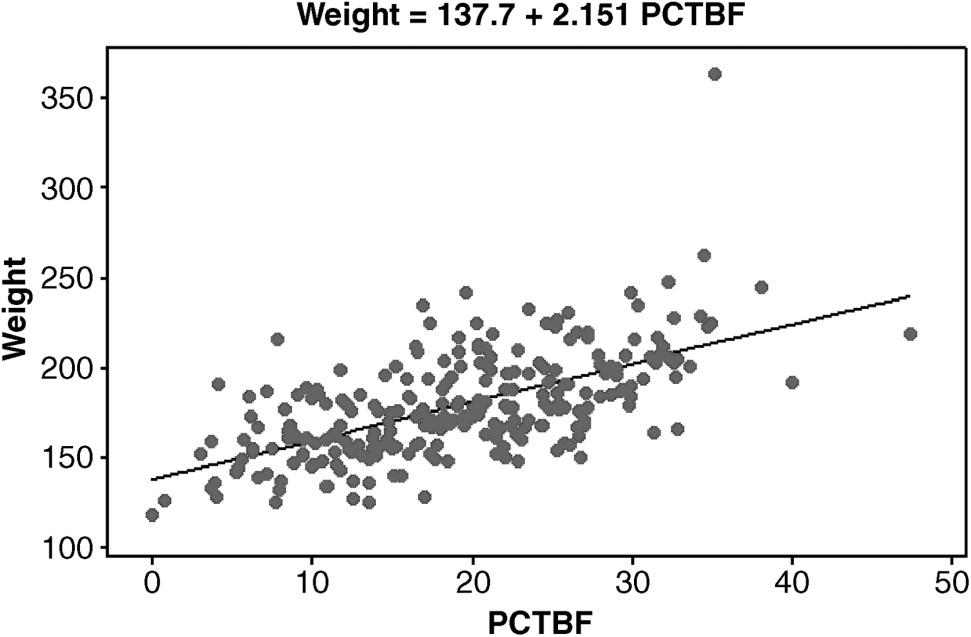
Figure 8.42 shows a fitted line plot for a simple linear regression model relating weight to percent
Question:
Figure 8.42 shows a fitted line plot for a simple linear regression model relating weight to percent body fat for adult males based on the Body Fat data set. Note that there is a bivariate outlier at approximately PCTBF = 35 and Weight = 360. Use the Body Fat data set to answer the following:

(a) Identify the observation that is the bivariate outlier.
(b) Temporarily delete the observation that is the bivariate outlier from the data set.
(c) Refit the simple linear regression model to the reduced data set.
(d) Compare the equations of the least squares regression line based on the complete and the reduced data sets.
(e) Compare the values of ????e and ????2 for the simple linear regression model fit to the complete and the reduced data sets.
(f) Compare the residual plots and normal probability plots for the simple linear regression model fit to the complete and the reduced data sets.
Step by Step Answer:

Applied Biostatistics For The Health Sciences
ISBN: 9781119722694
2nd Edition
Authors: Richard J. Rossi


