

Patient Service Times The normal quantile plot represents service times (minutes) of randomly selected patients. 2 score
Question:
Patient Service Times The normal quantile plot represents service times (minutes) of randomly selected patients.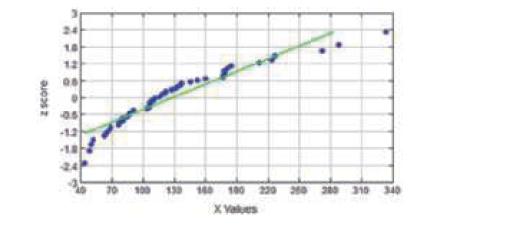
Step by Step Answer:

This question has not been answered yet.
You can Ask your question!
Related Book For 

Biostatistics For The Biological And Health Sciences
ISBN: 9780134039015
2nd Edition
Authors: Marc Triola, Mario Triola, Jason Roy
Question Posted:
