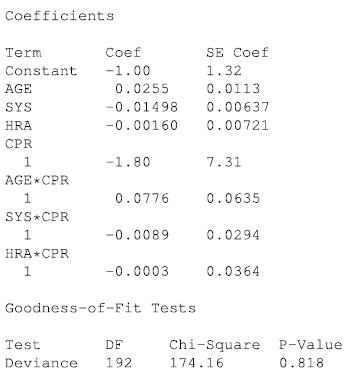
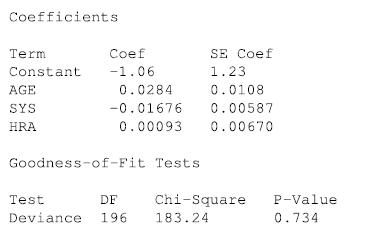
The information in Figures 10.20 and 10.21 are based on the ICU data set. Figure 10.23 results
Question:
The information in Figures 10.20 and 10.21 are based on the ICU data set. Figure 10.23 results from fitting the logistic regression interaction model with vital status
(STA) as the response variable with age (AGE), CPR prior to admission (CPR), systolic blood pressure at admission (SYS), and heart rate at admission (HRA) as the explanatory variables, and Figure 10.24 resulted from fitting the logistic regression model with STA as the response variable with AGE, SYS, and HRA as the explanatory variables. Use the information in Figures 10.20 and 10.21 and ???? = 200 to answer the following questions.
(a) Test the goodness-of-fit of the interaction model summarized in Figure 10.20.
 Figure 10.20 The MINITAB output for the interaction model in Exercise 10.51.
Figure 10.21

(b) Compare the fit of the models summarized in Figure 10.20 and Figure 10.21 using a drop-in-deviance test.
(c) Which model appears to be a better model for explaining the response variable according to the drop-in-deviance test? Explain.
(d) Compute the values of BIC for both models.
(e) Which model appears to be a better model for explaining the response variable according to BIC? Explain.
Step by Step Answer:

Applied Biostatistics For The Health Sciences
ISBN: 9781119722694
2nd Edition
Authors: Richard J. Rossi


