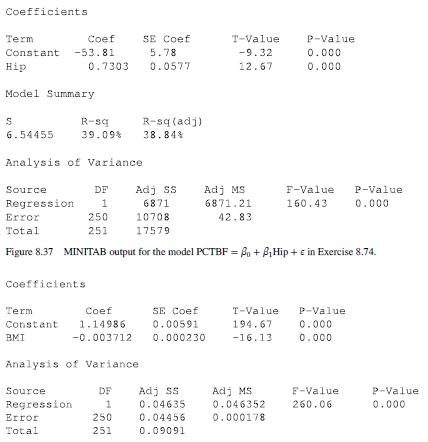
The MINITAB output given in Figure 8.37 resulted from fitting the model PCTBF = ????0 + ????1Hip
Question:
The MINITAB output given in Figure 8.37 resulted from fitting the model PCTBF = ????0 + ????1Hip + ????
Use the MINITAB output given in Figure 8.37 to answer the following questions.
(a) What is the equation of the least squares regression line?
(b) What is the estimate of ?????
(c) What is the percentage of the total variation in PCTBF explained by this simple linear regression model?
(d) Test ????0 ∶ ????1 = 0 at the ???? = 0.05 level.
(e) Compute a 95% confidence interval for ????1.
(f) Determine the value of the sample correlation between PCTBF and Hip.

Fantastic news! We've Found the answer you've been seeking!
Step by Step Answer:
Related Book For 

Applied Biostatistics For The Health Sciences
ISBN: 9781119722694
2nd Edition
Authors: Richard J. Rossi
Question Posted:


