

Using the five-number summary given in Table 4.20 (a) construct an outlier boxplot. (b) describe the general
Question:
Using the five-number summary given in Table 4.20
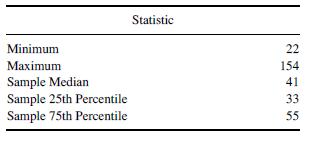
(a) construct an outlier boxplot.
(b) describe the general shape of the distribution suggested by the boxplot in part (a).
(c) estimate the interquartile range.
(d) determine whether or not there are any extreme outliers in the data set.
Fantastic news! We've Found the answer you've been seeking!
Step by Step Answer:

Answered By
Mugdha Sisodiya
My self Mugdha Sisodiya from Chhattisgarh India. I have completed my Bachelors degree in 2015 and My Master in Commerce degree in 2016. I am having expertise in Management, Cost and Finance Accounts. Further I have completed my Chartered Accountant and working as a Professional.
Since 2012 I am providing home tutions.
2+ Reviews
10+ Question Solved
Related Book For 
Applied Biostatistics For The Health Sciences
ISBN: 9781119722694
2nd Edition
Authors: Richard J. Rossi
Question Posted:
