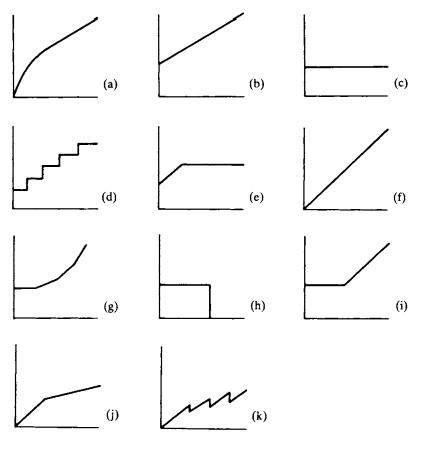
Shown below are graphs reflecting factory cost of expense data over varying production levels. The vertical axis
Question:
Shown below are graphs reflecting factory cost of expense data over varying production levels. The vertical axis of each graph represents total pounds (£) of expenses and the horizontal axis represents production levels.

(a) You are required to indicate by letter which of the graphs represents each of the situations or items described below (the graphs may be used more than once or not at all):
(i) a royalty charge of £1 per unit produced up to 1,000 units, after which the charge is 60p per unit;
(ii) annual rent of the factory;
(iii) rates for a factory where a public authority waives the rates if 500 or more local men are employed;
(iv) material costs for production at £1.50 per unit of material;
(v) material costs for production based on the following scale of charges:
£8.00 for 1st unit produced £7.50 for 2nd unit produced £7.00 for 3rd unit produced, etc., reducing to a minimum cost per units produced of £4 (vi) electricity charge based on fixed charge plus £4 per unit of electricity used;
(vii) a water charge made up as follows:
1st 100 gal £1.00 next 100 gal 15p per gal next 100 gal 20p per gal all other gallonage 25p per gal
(b) For each of the graphs not associated with one of the given situations give a brief explanation of the cost behaviour and suggest what the cost might be.
(c) In what way does a knowledge of cost behaviour influence the usefulness of budgetary control?
Step by Step Answer:


