Figure 13.31 shows the sensitivity report after solving the Crebo Manufacturing model (Example 13.12) using Solver. Using
Question:
Figure 13.31 shows the sensitivity report after solving the Crebo Manufacturing model (Example 13.12)
using Solver. Using only the information in the sensitivity report, answer the following questions.
a. Explain the value of the reduced cost (-0.3) for the number of plugs to produce.
b. If the gross margin for rails is decreased to $1.05, can you predict what the optimal solution and profit will be?
c. Suppose that the gross margin for rivets is increased to $0.85. Can you predict what the optimal solution and profit will be?
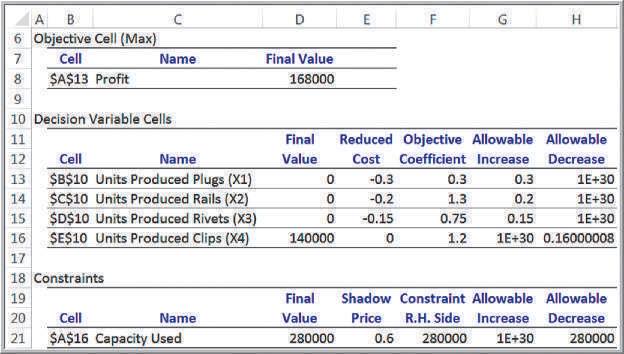
d. If the gross margin for clips is reduced to $1.10, can you predict what the optimal solution and profit will be? What if the gross margin is reduced to $1.00?
e. Suppose that an additional 500 minutes of machine capacity is available. How will the optimal solution and profit change? What if planned maintenance reduces capacity by 300 minutes?
Step by Step Answer: