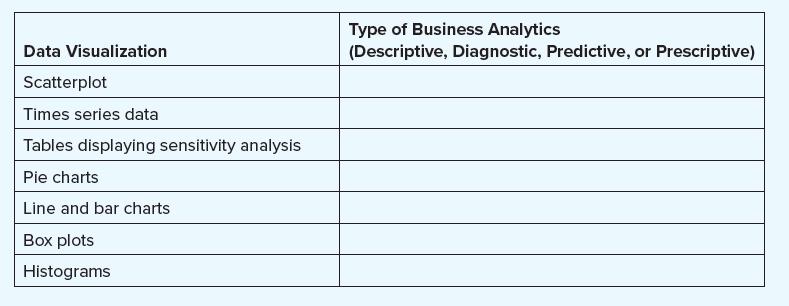
Match the data visualization with the type of business analytics (descriptive, diagnostic, predictive, or prescriptive) it is
Question:
Match the data visualization with the type of business analytics (descriptive, diagnostic, predictive, or prescriptive) it is most associated with.
Transcribed Image Text:
Data Visualization Scatterplot Times series data Tables displaying sensitivity analysis Pie charts Line and bar charts Box plots Histograms Type of Business Analytics (Descriptive, Diagnostic, Predictive, or Prescriptive)
Fantastic news! We've Found the answer you've been seeking!
Step by Step Answer:
Answer rating: 100% (7 reviews)
Data Visualization Type of Business Analytics Descriptive Diag...View the full answer

Answered By

HARSH RANJAN
Taken classes at college to graduates, Also worked as an expert to a freelancer online question-solving portal for more than 8 months with an average rating greater than 4.2 out of 5.
5.00+
1+ Reviews
10+ Question Solved
Related Book For 

Introduction To Business Analytics
ISBN: 9781265454340
1st Edition
Authors: Vernon Richardson, Marcia Watson
Question Posted:
Students also viewed these Business questions
-
The main project: In this project, you are either work on the hypothetical company or an existing company. In either case, you are supposed to develop a Business Intelligence Development Plan for a...
-
Match the following terms to the appropriate definitions: _______ Hive a. knowledge discovery using a variety of statistical and computational techniques _______ Text mining b. analytics that...
-
1. Identify the phrase that best defines audit data analytics (ADAs). a Science and art of discovering and analyzing patterns, identifying anomalies, and extracting other useful information in data...
-
Requests are not usually uniformly distributed. For example, a cylinder containing the file system FAT or in odes can be expected to be accessed more frequently than a cylinder that only contains...
-
During the current year, Blake Construction disposed of plant assets in the following transactions: Jan. 6 Equipment costing $18,000 was given to a scrap dealer at no charge. At the date of disposal,...
-
Find the standard deviation for the indicated sets of numbers. A calculator may be used. The X-ray dosages in Exercise 25 Data from Exercises 25 The dosage (in mR) given by a particular X-ray machine...
-
Why do firms change packaging?
-
Giant Jets is a French company that produces jet airplanes for commercial cargo companies. The selling price (in euros) per jet is 1,000,000. Currently the company uses actual volumes to allocate...
-
1 EAS. LO 10.3 Calculate the cost of goods sold dollar value for A65 Company for the month, 2 considering the following transactions under three different cost allocation methods and using 3...
-
In what way is a box plot more informative than a histogram?
-
Examine the data visualization below. Is it a histogram or a bar chart? How can you? Total Sales 2,000,000 1,500,000 1,000,000 500,000 North Total Sales by Region South Region East West
-
Rewrite Programming Exercise 8.37? to store pairs of each state and its capital in a map. Your program should prompt the user to enter a state and should display the capital for the state. Write a...
-
Locate a scholarly article relevant to how to present your financial plan for opening a Roller Skating Rink (from your draft business plan) to a lending institution--and describe your strategy for...
-
How would you expect seasonal fluctuations in demand to affect a rental company's decisions about pricing rented products such as wedding dresses or convertible cars? In terms of pricing principles,...
-
Do we drive technology, or does technology drive us? If technology drives us, what are the risks? The other side of the coin would be that we are able to stay ahead of technological transformations....
-
How do you explain the differences between the two analyses and what are the implications of using the BCG matrix in practice?
-
How do leadership styles, such as transformational leadership, shared leadership, and servant leadership, impact team dynamics, member motivation, and overall team effectiveness ?
-
The widget industry in Springfield is competitive, with numerous buyers and sellers. Consumers don't differentiate among the various brands of widgets (no product differentiation). The industry...
-
Which of the followingcarbocations is the least stable? CH3CH2 . CH3CHCH3 CH3 I . CH3C0 T CH3 IV. V. CH3 CH3CCH2 CH3
-
Use regression analysis to fit an additive seasonal model with linear trend to the data set. a. What is the estimated regression function? b. Interpret the R2 value for your model. c. Interpret the...
-
Use regression analysis to fit a linear trend model to the data set. a. What is the estimated regression function? b. Interpret the R2 value for your model. c. Prepare a line graph comparing the...
-
Use regression analysis to fit a quadratic trend model to the data set. a. What is the estimated regression function? b. Compare the adjusted-R2 value for this model to that of the linear trend...
-
Series of Compound Interest Techniques The following are several situations involving compound interest. Required: Using the appropriate table, solve each of the following: ( Click here to access the...
-
If Clark Kelly has recognized gain on an exchange of like-kind property held for investment use, where does Clark report the gain? First on Form 8824, then carried to Schedule D. First on Form 8824,...
-
An investor put 40% of her money in Stock A and 60% in Stock B. Stock A has a beta of 1.2 and Stock B has a beta of 1.6. If the risk-free rate is 5% and the expected return on the market is 12%,...

Study smarter with the SolutionInn App


