

Question: 16. Consider the following two frequency distributions. The first frequency distribution provides an approximation of the annual adjusted gross income in the United States (Internal
16. Consider the following two frequency distributions. The first frequency distribution provides an approximation of the annual adjusted gross income in the United States (Internal Revenue Service, March 2003). The second frequency distribution shows exam scores for students in a college statistics course.
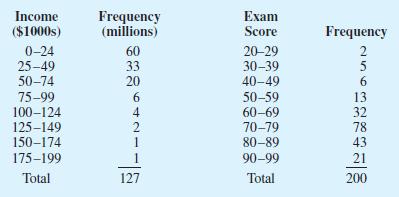
a. Develop a histogram for the annual income data. What evidence of skewness does it show? Does this skewness make sense? Explain.
b. Develop a histogram for the exam score data. What evidence of skewness does it show? Explain.
c. Develop a histogram for the data in exercise 11. What evidence of skewness does it show? What is the general shape of the distribution?
Income Frequency Exam ($1000s) (millions) Score Frequency 0-24 60 20-29 24 25-49 33 30-39 5 50-74 20 40-49 6 75-99 6 50-59 13 100-124 4 60-69 32 125-149 2 70-79 78 150-174 80-89 43 175-199 90-99 21 Total 127 Total 200
Step by Step Solution
There are 3 Steps involved in it

Get step-by-step solutions from verified subject matter experts