

The monthly closing stock prices (rounded to the nearest dollar) for Panera Bread Co. for the first
Question:
The monthly closing stock prices (rounded to the nearest dollar) for Panera Bread Co. for the first six months of 2010 are reported in the following table.
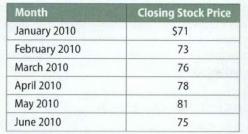
a. Calculate the sample mean and the sample standard deviation.
b. Compute the 90% confidence interval of the mean stock price of Panera Bread Co., assuming that the stock price is normally distributed.
c. What happens to the margin of error if a higher confidence level is used for the interval estimate? P-69
Fantastic news! We've Found the answer you've been seeking!
Step by Step Answer:

Answered By
Akash Goel
I am in the teaching field since 2008 when i was enrolled myself in chartered accountants course
Since then i have an experience of teaching of class XI, XII, BCOM, MCOM, MBA, CA CPT.
1+ Reviews
10+ Question Solved
Related Book For 

Business Statistics Communicating With Numbers
ISBN: 9780071317610
1st Edition
Authors: Kelly Jaggia
Question Posted:
