

46. CEOs revisited. In Exercise 44 you looked at the annual compensation for 800 CEOs, for which...
Question:
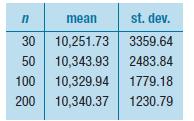
46. CEOs revisited. In Exercise 44 you looked at the annual compensation for 800 CEOs, for which the true mean and standard deviation were (in thousands of dollars) 10,307.31 and 17,964.62, respectively. A simulation drew samples of sizes 30, 50, 100, and 200 (with replacement) from the total annual compensations of the Fortune 800 CEOs. The summary statistics for these simulations were as follows:
a) According to the Central Limit Theorem, what should the theoretical mean and standard deviation be for each of these sample sizes?
b) How close are the theoretical values to what was observed from the simulation?
c) Looking at the histograms in Exercise 44, at what sample size would you be comfortable using the Normal model as an approximation for the sampling distribution?
d) What about the shape of the distribution of Total Compensation explains your answer in part c?
Step by Step Answer:


Business Statistics
ISBN: 9780321716095
2nd Edition
Authors: Norean D. Sharpe, Paul F. Velleman, David Bock, Norean Radke Sharpe
