Country export. The following is a regression that models a list of countries exports (million tons) in
Question:
Country export. The following is a regression that models a list of countries’ exports (million tons) in terms of trade variables. The variables are GDP (%), Value exported
($ thousand), Trade balance ($ thousand), and Share (%) in the world exports.
Dependent variable is: exports (million tons)
R-squared = 0.7380, Adjusted R-squared: 0.7147 SE = 1189.5142 with 50 observations Variable Coefficient SE(Coeff) t-ratio P-value Intercept 1589.1663 661.4971 2.4024 0.0205 GDP -18.0082 8.0709 -2.2312 0.0307 Value exported 0.0007 0.0001 10.5652 0.0000 Trade balance -0.0851 0.0727 -1.1711 0.2477 Share 963.1313 648.5793 1.4850 0.1445
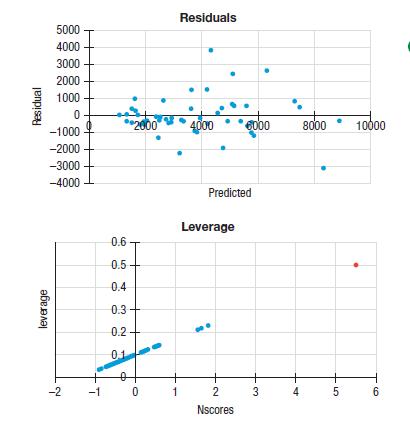
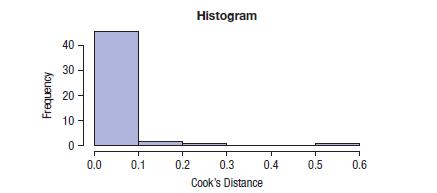
a) The state with the highest leverage and largest Cook’s Distance is Malta. It is plotted in red in the normal probability plot of the leverage values. Here are a scatterplot of the residuals, a normal probability plot of the leverage values, and a histogram of Cook’s distance values. What evidence do you have from these diagnostic plots that Malta might be an inf luential point?

Here is another regression with a dummy variable for Malta added to the regression model.
Dependent variable is: countries’ exports (million tons)
R-squared = 0.7462, Adjusted R-squared: 0.7174 SE = 1183.8776 with 50 observations Variable Coefficient SE(Coeff) t-ratio P-value Intercept 1895.7993 706.5510 2.6832 0.0102 GDP -27.3163 11.1862 -2.4420 0.0187 Value exported 0.0007 0.0001 10.6572 0.0000 Trade balance -0.0912 0.0725 -1.2584 0.2149 Share 1023.6589 647.4880 1.5810 0.1210 Malta 1995.0011 1668.5844 1.1956 0.2382
b) What does the coefficient for the dummy variable for Malta mean? Is there evidence that Malta is an outlier in this model?
c) Which model would you prefer for understanding or predicting Exports? Explain.
Step by Step Answer:

Business Statistics
ISBN: 9781292269313
4th Global Edition
Authors: Norean Sharpe, Richard De Veaux, Paul Velleman


