

Expenses. Heres a scatterplot of the average monthly expenditure of households (in thousands of $) vs. the
Question:
Expenses. Here’s a scatterplot of the average monthly expenditure of households (in thousands of $) vs. the percentage spend on leisure activities by households (in blue) and their percentage spend on food (in red). A separate least squares regression line has been fitted to each group in the plot.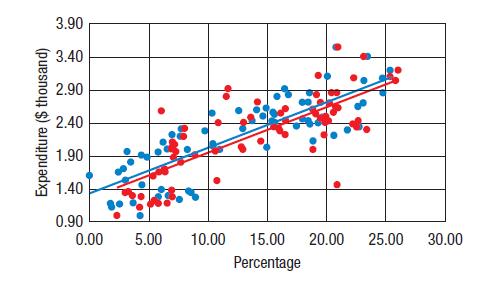
Examine the plot and answer the following questions:
a) What are the units for the slopes of these lines?
b) In what way are the percentage spending on leisure activities and food similar with respect to this relationship?
c) In what way are the percentage spend on leisure activities different from the percentage spend on food with respect to this relationship?
Step by Step Answer:

This question has not been answered yet.
You can Ask your question!


Business Statistics
ISBN: 9781292269313
4th Global Edition
Authors: Norean Sharpe, Richard De Veaux, Paul Velleman
