

Exponential smoothing. The following time series graph shows daily closing stock prices (adjusted for splits and dividends)
Question:
Exponential smoothing. The following time series graph shows daily closing stock prices (adjusted for splits and dividends) for Google, Inc. from February 1, 2008, through June 30, 2008 (Source: Yahoo! Finance).
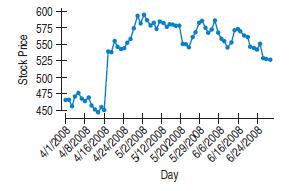
a) Which time series components are evident?
Single exponential smoothing (SES) models were found for these data. Examine the time series graphs on the next page showing two different smoothing coefficients values (a = 0.2 and a = 0.8).
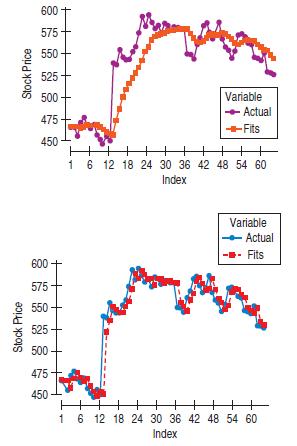
b) In which graph is a larger value of used?
Step by Step Answer:

This question has not been answered yet.
You can Ask your question!
Related Book For 

Business Statistics
ISBN: 9780321716095
2nd Edition
Authors: Norean D. Sharpe, Paul F. Velleman, David Bock, Norean Radke Sharpe
Question Posted:
