

Female president. The Gallup organization has, over six decades, periodically asked the following question: If your party
Question:
Female president. The Gallup organization has, over six decades, periodically asked the following question:
If your party nominated a generally well-qualified person for president who happened to be a woman, would you vote for that person?
We wonder if the proportion of the public who have “no opinion” on this issue has changed over the years. Here is a regression for the proportion of those respondents whose response to this question about voting for a woman president was “no opinion.” Assume that the conditions for inference are satisfied and that the response variable is proportion responding No Opinion.
Predictor Coeff SE(Coeff) t-Ratio P-Value Intercept 7.693 2.445 3.15 0.0071 Year -0.043 0.035 -1.21 0.2460 s = 2.28 R-Sq = 9.5%
a) State the hypotheses about the slope (both numerically and in words) that describes how voters’ thoughts have changed about voting for a woman.
b) Assuming that the conditions for inference are satisfied, perform the hypothesis test and state your conclusion.
c) Examine the scatterplot corresponding to the regression for No Opinion. How does it change your opinion of the trend in “no opinion” responses? Do you think the true slope is negative as shown in the regression output?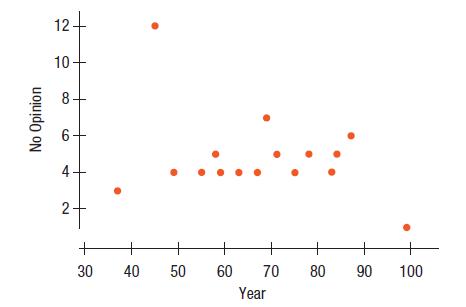
Step by Step Answer:


Business Statistics
ISBN: 9781292269313
4th Global Edition
Authors: Norean Sharpe, Richard De Veaux, Paul Velleman
