

Hawaii tourism, part 2. In Exercise 39 we examined domestic tourists who visit Hawaii. Now, lets consider
Question:
Hawaii tourism, part 2.
In Exercise 39 we examined domestic tourists who visit Hawaii. Now, let’s consider international tourism. Here’s a time series plot of international visitors.
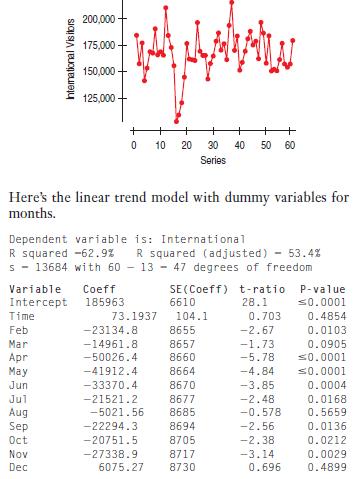
a) Interpret the P-value for the Time coefficient.
b) The for this model is lower than for the model fit to domestic visitors in Exercise 39.
Does that mean that an exponential trend model would do better?
c) International tourists often visit Hawaii in January. How can you tell that from this model?
d) Even though the for this model is lower than the corresponding for the model fit in Exercise 39 to domestic tourist visits, you might feel more comfortable predicting the number of international visitors for April 2007 with this model than you did predicting the number of domestic visitors with the previous model. Explain why.
Step by Step Answer:

This question has not been answered yet.
You can Ask your question!


Business Statistics
ISBN: 9780321716095
2nd Edition
Authors: Norean D. Sharpe, Paul F. Velleman, David Bock, Norean Radke Sharpe
