

High school dropout rates (percentages) for 2008 for the 50 states were given in the 2008 Kids
Question:
High school dropout rates (percentages) for 2008 for the 50 states were given in the 2008 Kids Count Data Book (www.aecf.org) and are shown in the following table:
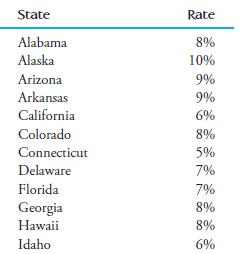
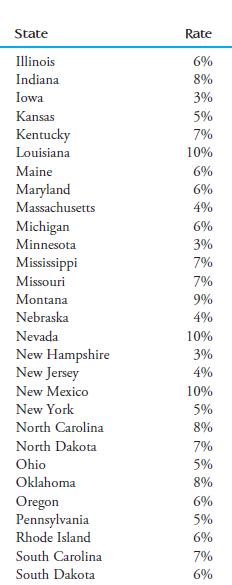
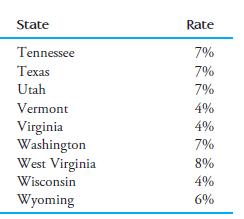
Note that dropout rates range from a low of 3% to a high of 10%. In constructing a stem-and-leaf display for these data, if we regard each dropout rate as a two-digit number and use the first digit for the stem, then there are only two possible stems, 0 and 1. One solution is to use repeated stems. Consider a scheme that divides the leaf range into five parts: 0 and 1, 2 and 3, 4 and 5, 6 and 7, and 8 and 9. Then, for example, stem 0 could be repeated as 0 with leaves 0 and 1 0t with leaves 2 and 3 0f with leaves 4 and 5 0s with leaves 6 and 7 0* with leaves 8 and 9 Construct a stem-and-leaf display for this data set that uses stems 0t, 0f, 0s, 0*, and 1. Comment on the important features of the display.
Step by Step Answer:


Introduction To Statistics And Data Analysis
ISBN: 9780840054906
4th Edition
Authors: Roxy Peck, Chris Olsen, Jay L. Devore
