

Historical interest rates. Heres a plot showing the federal rate on 3-month Treasury bills from 1950 to
Question:
Historical interest rates. Here’s a plot showing the federal rate on 3-month Treasury bills from 1950 to 1980, and a regression model fit to the relationship between the Rate
(in %) and Years since 1950. (www.gpoaccess.gov/eop/)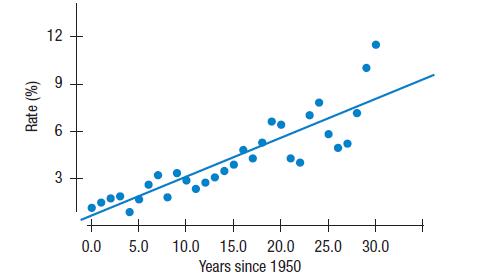
Dependent variable is: Rate R-squared = 77.4% s = 1.239 Variable Coeff Intercept 0.640282 Year-1950 0.247637
a) What is the correlation between Rate and Year?
b) Interpret the slope and intercept.
c) What does this model predict for the interest rate in the year 2000?
d) Would you expect this prediction to have been accurate?
Explain.
Step by Step Answer:

This question has not been answered yet.
You can Ask your question!
Related Book For 

Business Statistics
ISBN: 9781292269313
4th Global Edition
Authors: Norean Sharpe, Richard De Veaux, Paul Velleman
Question Posted:
