

Mens weekly earnings. This graph shows the quarterly median weekly earnings from the first quarter of 2000
Question:
Men’s weekly earnings. This graph shows the quarterly median weekly earnings from the first quarter of 2000 through the fourth quarter of 2007 for men, 25 years of age or older, in the United States (www.bls.gov).
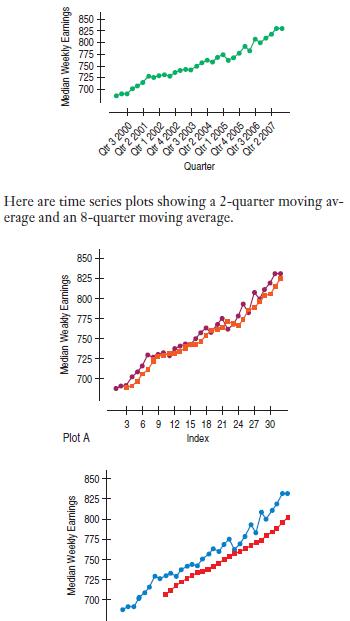
Identify which plot is the 2-quarter moving average and which is the 8-quarter moving average. Explain why the better-fitting model fits better.
Step by Step Answer:

This question has not been answered yet.
You can Ask your question!
Related Book For 

Business Statistics
ISBN: 9780321716095
2nd Edition
Authors: Norean D. Sharpe, Paul F. Velleman, David Bock, Norean Radke Sharpe
Question Posted:
