

Oakland outlier. The plot of residuals in Exercise 41 shows an outlier that wasnt as evident in
Question:
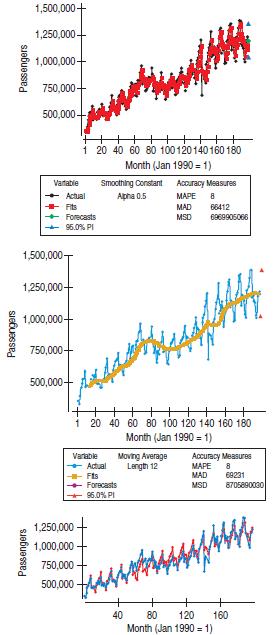
Oakland outlier. The plot of residuals in Exercise 41 shows an outlier that wasn’t as evident in the data. The outlier is September 2001. Clearly, this wasn’t a typical month for air travel. Here are three models fit to this series, a single exponential smooth, a 12-point moving average, and the fitted values from the seasonal regression model of Exercise 41.
Discuss how each deals with the outlier.
The remaining exercises require the use of statistics software.
Statistics packages vary in their capabilities and in the default decisions that some make. As a result, depending upon which package you choose, your answers may differ from those in the back of the book.
Step by Step Answer:

This question has not been answered yet.
You can Ask your question!


Business Statistics
ISBN: 9780321716095
2nd Edition
Authors: Norean D. Sharpe, Paul F. Velleman, David Bock, Norean Radke Sharpe
