

Oakland passengers. Much attention has been paid to the challenges faced by the airline industry. Patterns in
Question:
Oakland passengers. Much attention has been paid to the challenges faced by the airline industry. Patterns in customer demand are an important variable to watch. The scatterplot below shows the number of passengers departing from Oakland (CA) airport month by month from 1990 to 2007. Time is shown as years since 1990, with fractional years used to represent each month. (Data selected from Oakland passengers 2016)
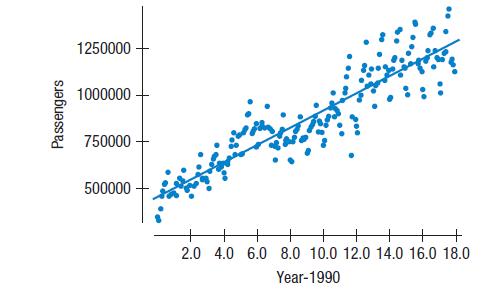
Here’s a regression with the residuals plotted against the predicted values R squared = 85.2% s = 100359 Variable Coefficient Intercept 455650 year-1990 46131.3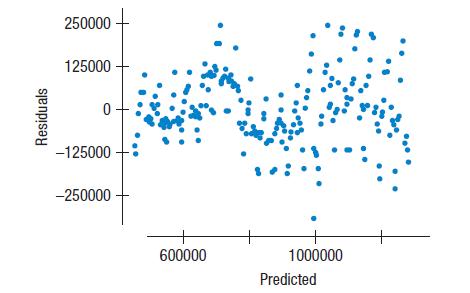
a) Interpret the slope and intercept of the regression model.
b) What does the value of R2 say about how successful the model is?
c) Interpret se in this context.
d) Would you use this model to predict the numbers of passengers in 2010 (Years - 1990 = 20)? Explain.
Step by Step Answer:


Business Statistics
ISBN: 9781292269313
4th Global Edition
Authors: Norean Sharpe, Richard De Veaux, Paul Velleman
