

Oakland passengers, part 2. In Exercise 29, we created a linear model describing the trend in the
Question:
Oakland passengers, part 2.
In Exercise 29, we created a linear model describing the trend in the number of passengers departing from Oakland (CA) airport each month from 1997 to 2007. Here’s the residual plot, but with lines added to show the order of the values in time: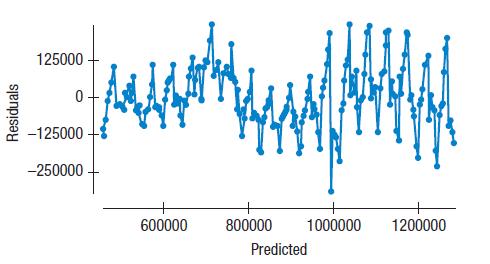
a) Can you account for the pattern shown here?
b) Would a re-expression help us deal with this pattern?
Explain.
Step by Step Answer:

This question has not been answered yet.
You can Ask your question!
Related Book For 

Business Statistics
ISBN: 9781292269313
4th Global Edition
Authors: Norean Sharpe, Richard De Veaux, Paul Velleman
Question Posted:
