

Oakland passengers. The Port of Oakland airport reports the number of passengers passing through each month. At
Question:
Oakland passengers. The Port of Oakland airport reports the number of passengers passing through each month. At first glance, this is just simple growth, but by recognizing the series as a time series, we may learn more.
The following plot was created in Excel.
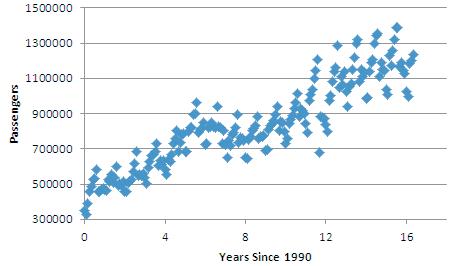
The increasing spread of the data suggests that a multiplicative model may fit better.
Here’s an exponential trend model with seasonal (monthly)
dummy variables.
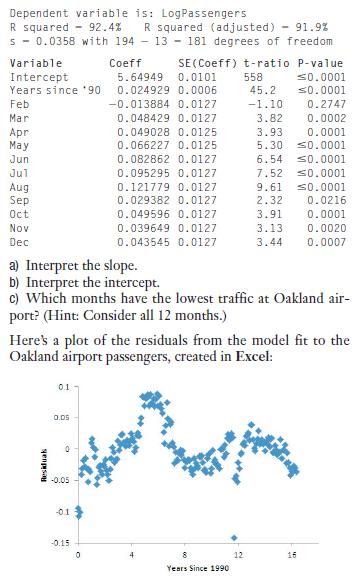
d) What components would you now say are in this series?
Step by Step Answer:

This question has not been answered yet.
You can Ask your question!
Related Book For 

Business Statistics
ISBN: 9780321716095
2nd Edition
Authors: Norean D. Sharpe, Paul F. Velleman, David Bock, Norean Radke Sharpe
Question Posted:
