

Palm oil, part 2. In Exercise 21, we looked at the global monthly prices of crude palm
Question:
Palm oil, part 2.
In Exercise 21, we looked at the global monthly prices of crude palm oil. Here we consider another global production—coconut oil—mainly exported by Philippines and Indonesia for the period 2018 to 2019.
The following graph shows the monthly prices for both crude palm oil and coconut oil. (https://www.indexmundi
.com/commodities/?commodity=coconut-oil&months=60)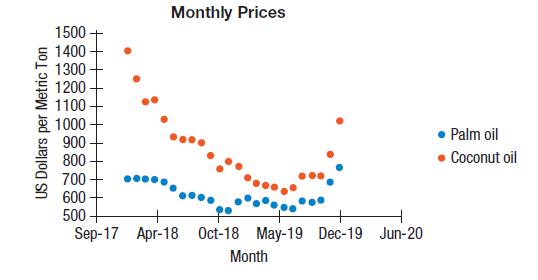
Clearly, the pattern for the price of coconut oil is about similar to the pattern for crude palm oil. But are the two lines getting closer together?
Here is a time plot showing the difference in price (coconut oil price – crude palm oil price), the regression analysis (using January 2018 as 1 and December 2019 as 24), and the associated residuals plot.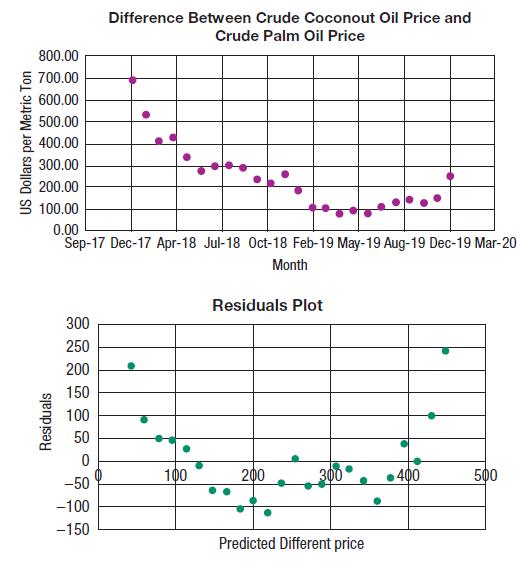
Regression Statistics Multiple R 0.8083 R Square 0.6534 Adjusted R Square 0.6377 Standard Error 92.5157 Observations 24 Variable Coefficient SE(Coeff) t-ratio P-value Intercept 464.6746 38.9815 11.9204 0.0000 Month -17.5702 2.7281 -6.4403 0.0000
a) What is the correlation between Price Difference and Month?
b) Interpret the slope of this line.
c) Predict the average price difference in December 2025.
d) Describe reasons why you might not place much faith in that prediction.
Step by Step Answer:

This question has not been answered yet.
You can Ask your question!


Business Statistics
ISBN: 9781292269313
4th Global Edition
Authors: Norean Sharpe, Richard De Veaux, Paul Velleman
