

Pizza ratings, part 2. Heres a scatterplot of the residuals against predicted values for the regression model
Question:
Pizza ratings, part 2.
Here’s a scatterplot of the residuals against predicted values for the regression model found in Exercise 17.
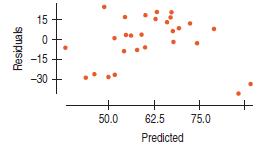
a) The two extraordinary points in the lower right are Reggio’s and Michelina’s, two gourmet brands. Interpret these points.
b) Do you think these two pizzas are likely to be influential in the regression. Would setting them aside be likely to change the coefficients? What other statistics might help you decide?
Fantastic news! We've Found the answer you've been seeking!
Step by Step Answer:

Answered By
Rohail Amjad
Experienced Finance Guru have a full grip on various sectors, i.e Media, Insurance, Automobile, Rice and other Financial Services.
Have also served in Business Development Department as a Data Anlayst
32+ Reviews
83+ Question Solved
Related Book For 

Business Statistics
ISBN: 9780321716095
2nd Edition
Authors: Norean D. Sharpe, Paul F. Velleman, David Bock, Norean Radke Sharpe
Question Posted:
