

Residential property. The scatterplot shows the monthly percentage change in the residential property price in a country
Question:
Residential property. The scatterplot shows the monthly percentage change in the residential property price in a country from May 2018 to April 2020. (Data in Residential Property)
A linear model fit to the relationship looks like this:
Regression Statistics Multiple R 0.9445 R Square 0.8920 Adjusted R Square 0.8871 Standard Error 0.0128 Observations 24 Variable Coefficient SE(Coeff) t-ratio P-value Intercept 7.3424 0.5415 13.5599 0.0000 Month -0.0002 0.0000 -13.4788 0.0000
a) Does the value 89.2% suggest that this is a good model?
Explain.
b) Here is a scatterplot of the residuals. Now do you think this is a good model for these data? Explain?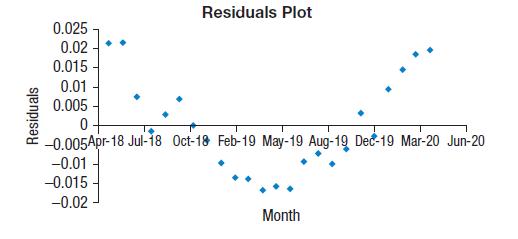
Step by Step Answer:


Business Statistics
ISBN: 9781292269313
4th Global Edition
Authors: Norean Sharpe, Richard De Veaux, Paul Velleman
