

The histogram shows the December charges (in $) for 5000 customers from one marketing segment from a
Question:
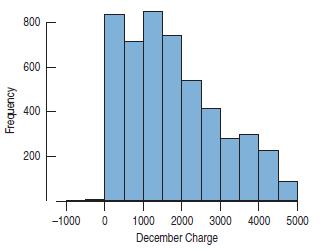
The histogram shows the December charges (in $) for 5000 customers from one marketing segment from a credit card company. (Negative values indicate customers who received more credits than charges during the month.)
a) Write a short description of this distribution (shape, center, spread, unusual features).
b) Would you expect the mean or the median to be larger?
Explain.
c) Which would be a more appropriate summary of the center, the mean or the median? Explain.
Fantastic news! We've Found the answer you've been seeking!
Step by Step Answer:

Answered By
Muhammad Umair
I have done job as Embedded System Engineer for just four months but after it i have decided to open my own lab and to work on projects that i can launch my own product in market. I work on different softwares like Proteus, Mikroc to program Embedded Systems. My basic work is on Embedded Systems. I have skills in Autocad, Proteus, C++, C programming and i love to share these skills to other to enhance my knowledge too.
1+ Reviews
10+ Question Solved
Related Book For 

Business Statistics
ISBN: 9780321716095
2nd Edition
Authors: Norean D. Sharpe, Paul F. Velleman, David Bock, Norean Radke Sharpe
Question Posted:
