

Ticket prices, diagnosed. Exercises in Chapter 18 considered weekly receipts from shows on Broadway in New York
Question:
Ticket prices, diagnosed. Exercises in Chapter 18 considered weekly receipts from shows on Broadway in New York City. To simplify matters, we omitted a few weeks from those data. Here is the same regression with all the data present.
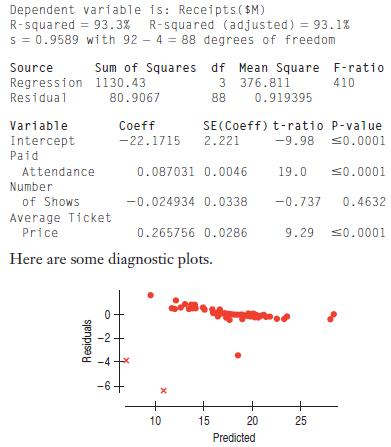
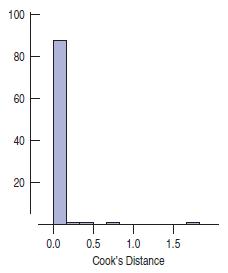
a) The two points plotted with x in the residuals vs. predicted plot are the two with the highest Cook’s Distances.
What does this information say about how those points might be affecting the analysis?
In fact, those points are reports published the last week of November and the first week of December in 2007—a time when the Stagehands Union Local One was on strike, closing down most Broadway shows. It seems that these are not representative weeks for business on Broadway.
Removing them results in the following regression.
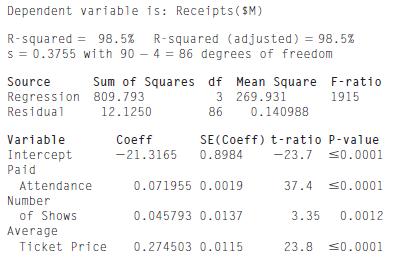
b) What changes in these estimated models support the conclusion that those two weeks were influential points?
(Hint: The increase in adjusted isn’t one of the reasons.)
c) Which model would be the best to use in analyzing the business of Broadway shows—the one with all the data or the one with the two influential points removed? Explain.
Step by Step Answer:

This question has not been answered yet.
You can Ask your question!


Business Statistics
ISBN: 9780321716095
2nd Edition
Authors: Norean D. Sharpe, Paul F. Velleman, David Bock, Norean Radke Sharpe
