

Traffic delays, part 2. Heres a scatterplot of the residuals from the regression in Exercise 18 plotted
Question:
Traffic delays, part 2.
Here’s a scatterplot of the residuals from the regression in Exercise 18 plotted against mean Highway mph.
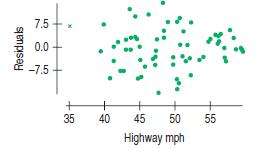
a) The point plotted with an x is Los Angeles. Read the graph and explain what it says about traffic delays in Los Angeles and about the regression model.
b) Is Los Angeles likely to be an influential point in this regression?
Step by Step Answer:

This question has not been answered yet.
You can Ask your question!
Related Book For 

Business Statistics
ISBN: 9780321716095
2nd Edition
Authors: Norean D. Sharpe, Paul F. Velleman, David Bock, Norean Radke Sharpe
Question Posted:
