

Traffic delays, part 3. Heres a plot of the Studentized residuals from the regression model of Exercise
Question:
Traffic delays, part 3.
Here’s a plot of the Studentized residuals from the regression model of Exercise 18 plotted against ArterialMPH. The plot is colored according to City Size (Small, Medium, Large, and Very Large), and regression lines are fit for each city size.
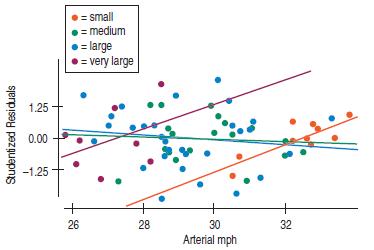
a) The model in Exercise 18 includes indicators for city size. Considering this display, have these indicator variables accomplished what is needed for the regression model? Explain.
Here is another model that adds two new constructed variables to the model in Exercise 18.
They are the product of ArterialMPH and Small and the product of ArterialMPH and VeryLarge.
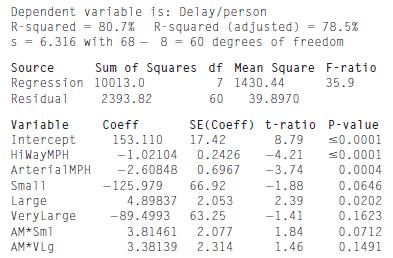
b) What does the predictor AM*Sml (ArterialMPH by Small) do in this model? Interpret the coefficient.
c) Does this model improve on the model in Exercise 18?
Explain.
Step by Step Answer:

This question has not been answered yet.
You can Ask your question!


Business Statistics
ISBN: 9780321716095
2nd Edition
Authors: Norean D. Sharpe, Paul F. Velleman, David Bock, Norean Radke Sharpe
