

Traffic delays, part 3. Heres a plot of the studentized residuals from the regression model of Exercise
Question:
Traffic delays, part 3.
Here’s a plot of the studentized residuals from the regression model of Exercise 18 plotted against ArterialMPH. The plot is colored according to City Size (Small, Medium, Large, and Very Large), and regression lines are fit for each city size.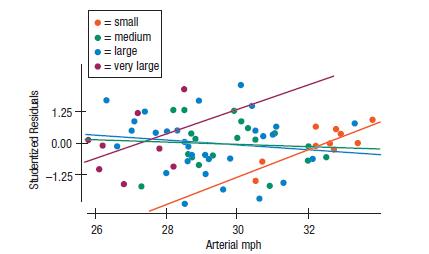
a) The model in Exercise 18 includes indicators for city size. Considering this display, have these indicator variables accomplished what is needed for the regression model?
Explain.
Here is another model that adds two new constructed variables to the model in Exercise 18.
They are the product of ArterialMPH and Small and the product of ArterialMPH and VeryLarge.
Dependent variable is: Delay/person R-squared = 80.7% R-squared (adjusted) = 78.5%
s = 6.316 with 68 - 8 = 60 degrees of freedom Source Sum of Squares df Mean Square F-ratio Regression 10013.0 7 1430.44 35.9 Residual 2393.82 60 39.8970 Variable Coefficient SE(Coeff) t-ratio P-value Intercept 153.110 17.42 8.79 60.0001 HiWayMPH -1.02104 0.2426 -4.21 60.0001 ArterialMPH -2.60848 0.6967 -3.74 0.0004 Small -125.979 66.92 -1.88 0.0646 Large 4.89837 2.053 2.39 0.0202 VeryLarge -89.4993 63.25 -1.41 0.1623 AM*Sml 3.81461 2.077 1.84 0.0712 AM*VLg 3.38139 2.314 1.46 0.1491
b) What does the predictor AM*Sml (ArterialMPH by Small) do in this model? Interpret the coefficient.
c) Does this model improve on the model in Exercise 18?
Explain.
Step by Step Answer:

This question has not been answered yet.
You can Ask your question!


Business Statistics
ISBN: 9781292269313
4th Global Edition
Authors: Norean Sharpe, Richard De Veaux, Paul Velleman
