

Unemployment rate, 2010. The histogram shows the monthly U.S. unemployment rate from January 2001 to January 2010.
Question:
Unemployment rate, 2010. The histogram shows the monthly U.S. unemployment rate from January 2001 to January 2010.
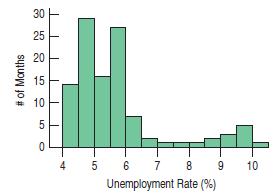
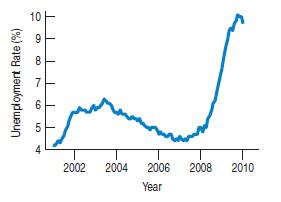
Here is the time series plot for the same data.
a) What features of the data can you see in the histogram that aren’t clear in the time series plot?
b) What features of the data can you see in the time series plot that aren’t clear in the histogram?
c) Which graphical display seems the more appropriate for these data? Explain.
d) Write a brief description of unemployment rates over this time period in the United States.
Step by Step Answer:

This question has not been answered yet.
You can Ask your question!
Related Book For 

Business Statistics
ISBN: 9780321716095
2nd Edition
Authors: Norean D. Sharpe, Paul F. Velleman, David Bock, Norean Radke Sharpe
Question Posted:
