

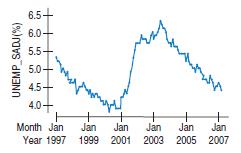
U.S. unemployment rate. Following is the time series plot for the monthly U.S. Unemployment rate (%) from
Question:
U.S. unemployment rate. Following is the time series plot for the monthly U.S. Unemployment rate (%) from January 1997 to March 2007. These data have been seasonally adjusted (meaning that the seasonal component has already been removed).
a) What time series components do you observe in this series?
b) Develop a 6-month and 12-month moving average model for this series.
c) Fit a single exponential smoothing model to this series.
d) Use these models to forecast the Unemployment rate for March 2007.
e) Compute measures of forecast error (e.g., MAD and MAPE) and compare the accuracy of the forecasts for these two models.
Step by Step Answer:

This question has not been answered yet.
You can Ask your question!


Business Statistics
ISBN: 9780321716095
2nd Edition
Authors: Norean D. Sharpe, Paul F. Velleman, David Bock, Norean Radke Sharpe
