

Youth unemployment 2016. Here is a scatterplot showing the regression line, 95% confidence intervals, and 95% prediction
Question:
Youth unemployment 2016. Here is a scatterplot showing the regression line, 95% confidence intervals, and 95%
prediction intervals, using youth unemployment data for a sample of 33 nations. The response variable is the Male Rate, and the predictor variable is the Female Rate.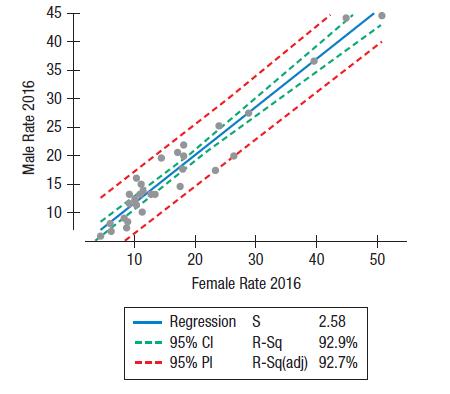
a) Explain the meaning of the 95% prediction intervals in this context.
b) Explain the meaning of the 95% confidence intervals in this context.
c) Using a statistics program, identify any unusual observations, and discuss their potential impact on the regression.
Fantastic news! We've Found the answer you've been seeking!
Step by Step Answer:

Answered By
Rohith Bellamkonda
I am studying in IIT Indore,the most prestigious institute of India.I love solving maths and enjoy coding
1+ Reviews
10+ Question Solved
Related Book For 

Business Statistics
ISBN: 9781292269313
4th Global Edition
Authors: Norean Sharpe, Richard De Veaux, Paul Velleman
Question Posted:
